
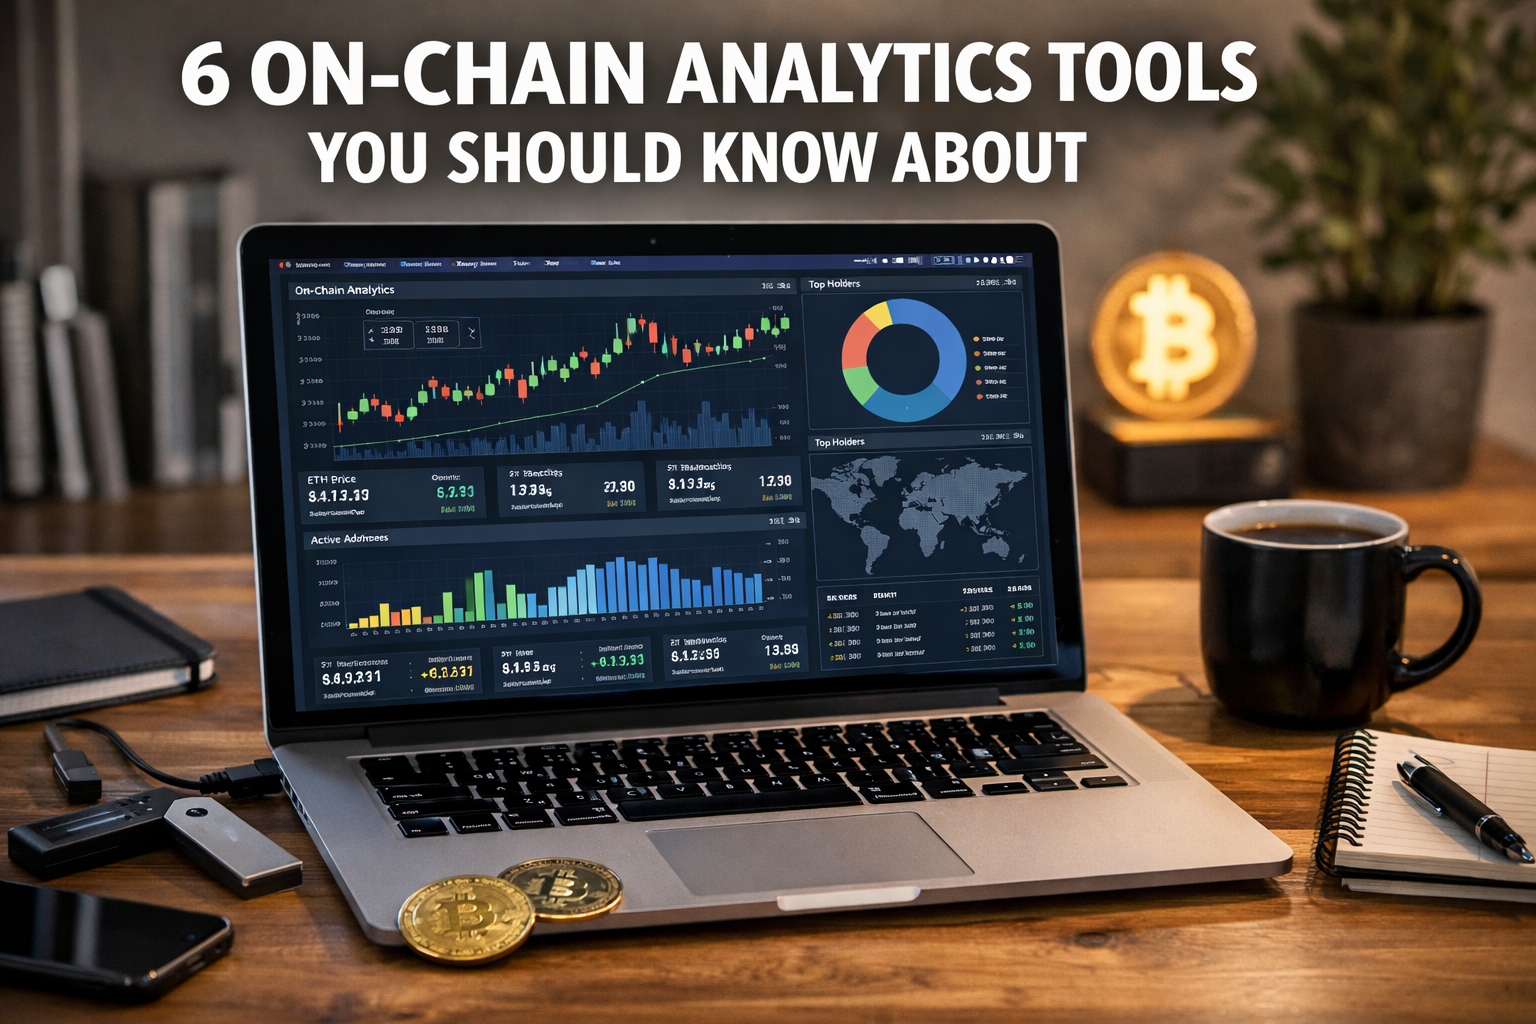
Blockchain data is publicly available, but turning raw transactions into meaningful insight requires specialized tools. On-chain analytics platforms help investors, analysts, and businesses understand network activity, user behavior, and market trends by interpreting blockchain data in real-time.
These tools are often used to contextualize price movements, including Bitcoin price shifts, by examining what is happening beneath the surface of the market. Understanding which platforms offer the most useful insights can help clarify trends that are not immediately visible on standard charts.
1. Glassnode
Glassnode is one of the most widely used on-chain analytics platforms, offering deep insights into blockchain activity across multiple networks. It focuses on metrics such as wallet behavior, exchange flows, and long-term holder activity. These data points help users understand whether assets are being accumulated, distributed, or held.
The platform is known for translating complex blockchain data into accessible indicators. Metrics such as realized value, spent output profit ratio, and holder age provide context around investor sentiment and network health. Glassnode is commonly used by analysts looking to identify broader market cycles rather than short-term price movements.
2. CryptoQuant
CryptoQuant specializes in exchange-related on-chain data, making it particularly useful for understanding the dynamics of supply and demand. By tracking inflows and outflows from centralized exchanges, the platform identifies when large amounts of assets are being moved on or off trading platforms.
These movements often signal changes in investor behavior, such as increased selling pressure or long-term holding strategies. CryptoQuant also offers miner-related data, including revenue and reserve changes, which can influence market conditions. Its dashboards are frequently used to assess potential market stress or accumulation phases.
3. Nansen
Nansen combines on-chain analytics with labeled wallet data to provide insight into the activities of different types of participants. By categorizing wallets associated with exchanges, funds, and large holders, Nansen allows users to track activity from specific market segments.
This labeling system makes it easier to interpret complex transaction data without manually analyzing addresses. Users can see trends such as institutional accumulation, smart money movements, or shifts in decentralized finance activity. Nansen is often favored for its ability to connect on-chain data with identifiable behavior patterns.
4. Santiment
Santiment integrates on-chain data with social and development metrics to provide a broader view of market activity. In addition to tracking transactions and wallet behavior, it analyzes social media trends, developer activity, and network growth.
This combination helps users understand how sentiment and on-chain fundamentals interact. For example, rising development activity alongside increased on-chain usage may indicate long-term network strength. Santiment is commonly used by those who want to correlate behavioral data with blockchain fundamentals rather than relying on transactions alone.
5. IntoTheBlock
IntoTheBlock focuses on delivering clear, indicator-driven insights derived from on-chain data. It emphasizes metrics related to holder profitability, ownership concentration, and transaction activity. These indicators help assess whether assets are being held at a profit or loss across the network.
The platform also uses machine learning models to generate probabilistic insights about market behavior. Its visual dashboards are designed to be accessible to users who may not have advanced technical backgrounds, making it useful for both individual investors and professionals.
6. Dune Analytics
Dune Analytics stands out for its customizable approach to on-chain data. Rather than offering predefined dashboards only, it allows users to build and share custom queries using blockchain data. This flexibility makes it popular among analysts, developers, and researchers.
Dune supports multiple blockchains and enables community-driven dashboards that cover a wide range of topics, from decentralized finance activity to NFT trends. Its open structure encourages transparency and collaboration, which allows users to explore niche metrics that may not be available on other platforms.
How On-Chain Tools Support Market Understanding
On-chain analytics tools help bridge the gap between raw blockchain data and actionable insight. By revealing how assets move, who is holding them, and how networks are used, these platforms provide context that price charts alone cannot offer. They are particularly valuable during periods of volatility, when understanding the underlying investor behavior becomes more important than short-term fluctuations.
Each analytics platform offers a different perspective on blockchain data. Some focus on exchange flows, others on wallet behavior or sentiment analysis. The right choice depends on whether the goal is long-term trend analysis, short-term risk assessment, or deeper research into network usage. Many users rely on multiple tools to gain a more complete picture.
Turning Data Into Better Decisions
On-chain analytics tools have become essential for anyone seeking a deeper understanding of blockchain ecosystems. By going beyond price and volume, they reveal patterns in behavior, adoption, and network health. When used thoughtfully, these platforms can support more informed decisions and a clearer view of how digital asset markets function beneath the surface.